OEE Fundamentals
:::info Quick Reference OEE = Availability x Performance x Quality
| Factor | Formula | Measures |
|---|---|---|
| Availability | Run Time / Planned Production Time | Was it running? |
| Performance | (Ideal Cycle Time x Total Pieces) / Run Time | Was it fast? |
| Quality | Good Pieces / Total Pieces | Was it good? |
Benchmarks: 85%+ = World-class | 60% = Typical | 40% = No tracking :::
What is OEE?
OEE (Overall Equipment Effectiveness) is the standard metric for measuring manufacturing productivity. It answers a simple question: how much of your planned production time is truly productive?
Think of it like fuel efficiency for a car: just as miles-per-gallon tells you how effectively your car uses fuel, OEE tells you how effectively your factory uses its scheduled production time. An OEE of 100% means you are manufacturing only good parts, as fast as possible, with no downtime.
OpSee is built around OEE. Every module (from equipment configuration to production dashboards) feeds into or consumes OEE data.
Why does OEE matter?
If you have never worked with a MES (Manufacturing Execution System) before, here is why OEE is the most important metric in any factory:
- Visibility: without OEE, production problems are invisible. Managers rely on gut feelings instead of data. OEE gives you a number to track, compare, and improve.
- Root cause analysis: OEE breaks down losses into three categories (availability, performance, quality), so you know where to focus improvement efforts.
- Benchmarking: OEE lets you compare shifts, lines, and plants on a common scale.
- Cost savings: every percentage point of OEE improvement translates directly into more output from existing equipment, without buying new machines.
:::tip Real-world impact A factory running at 60% OEE that improves to 75% OEE gains 25% more capacity from the same equipment. That can mean millions in avoided capital expenditure. :::
The OEE formula
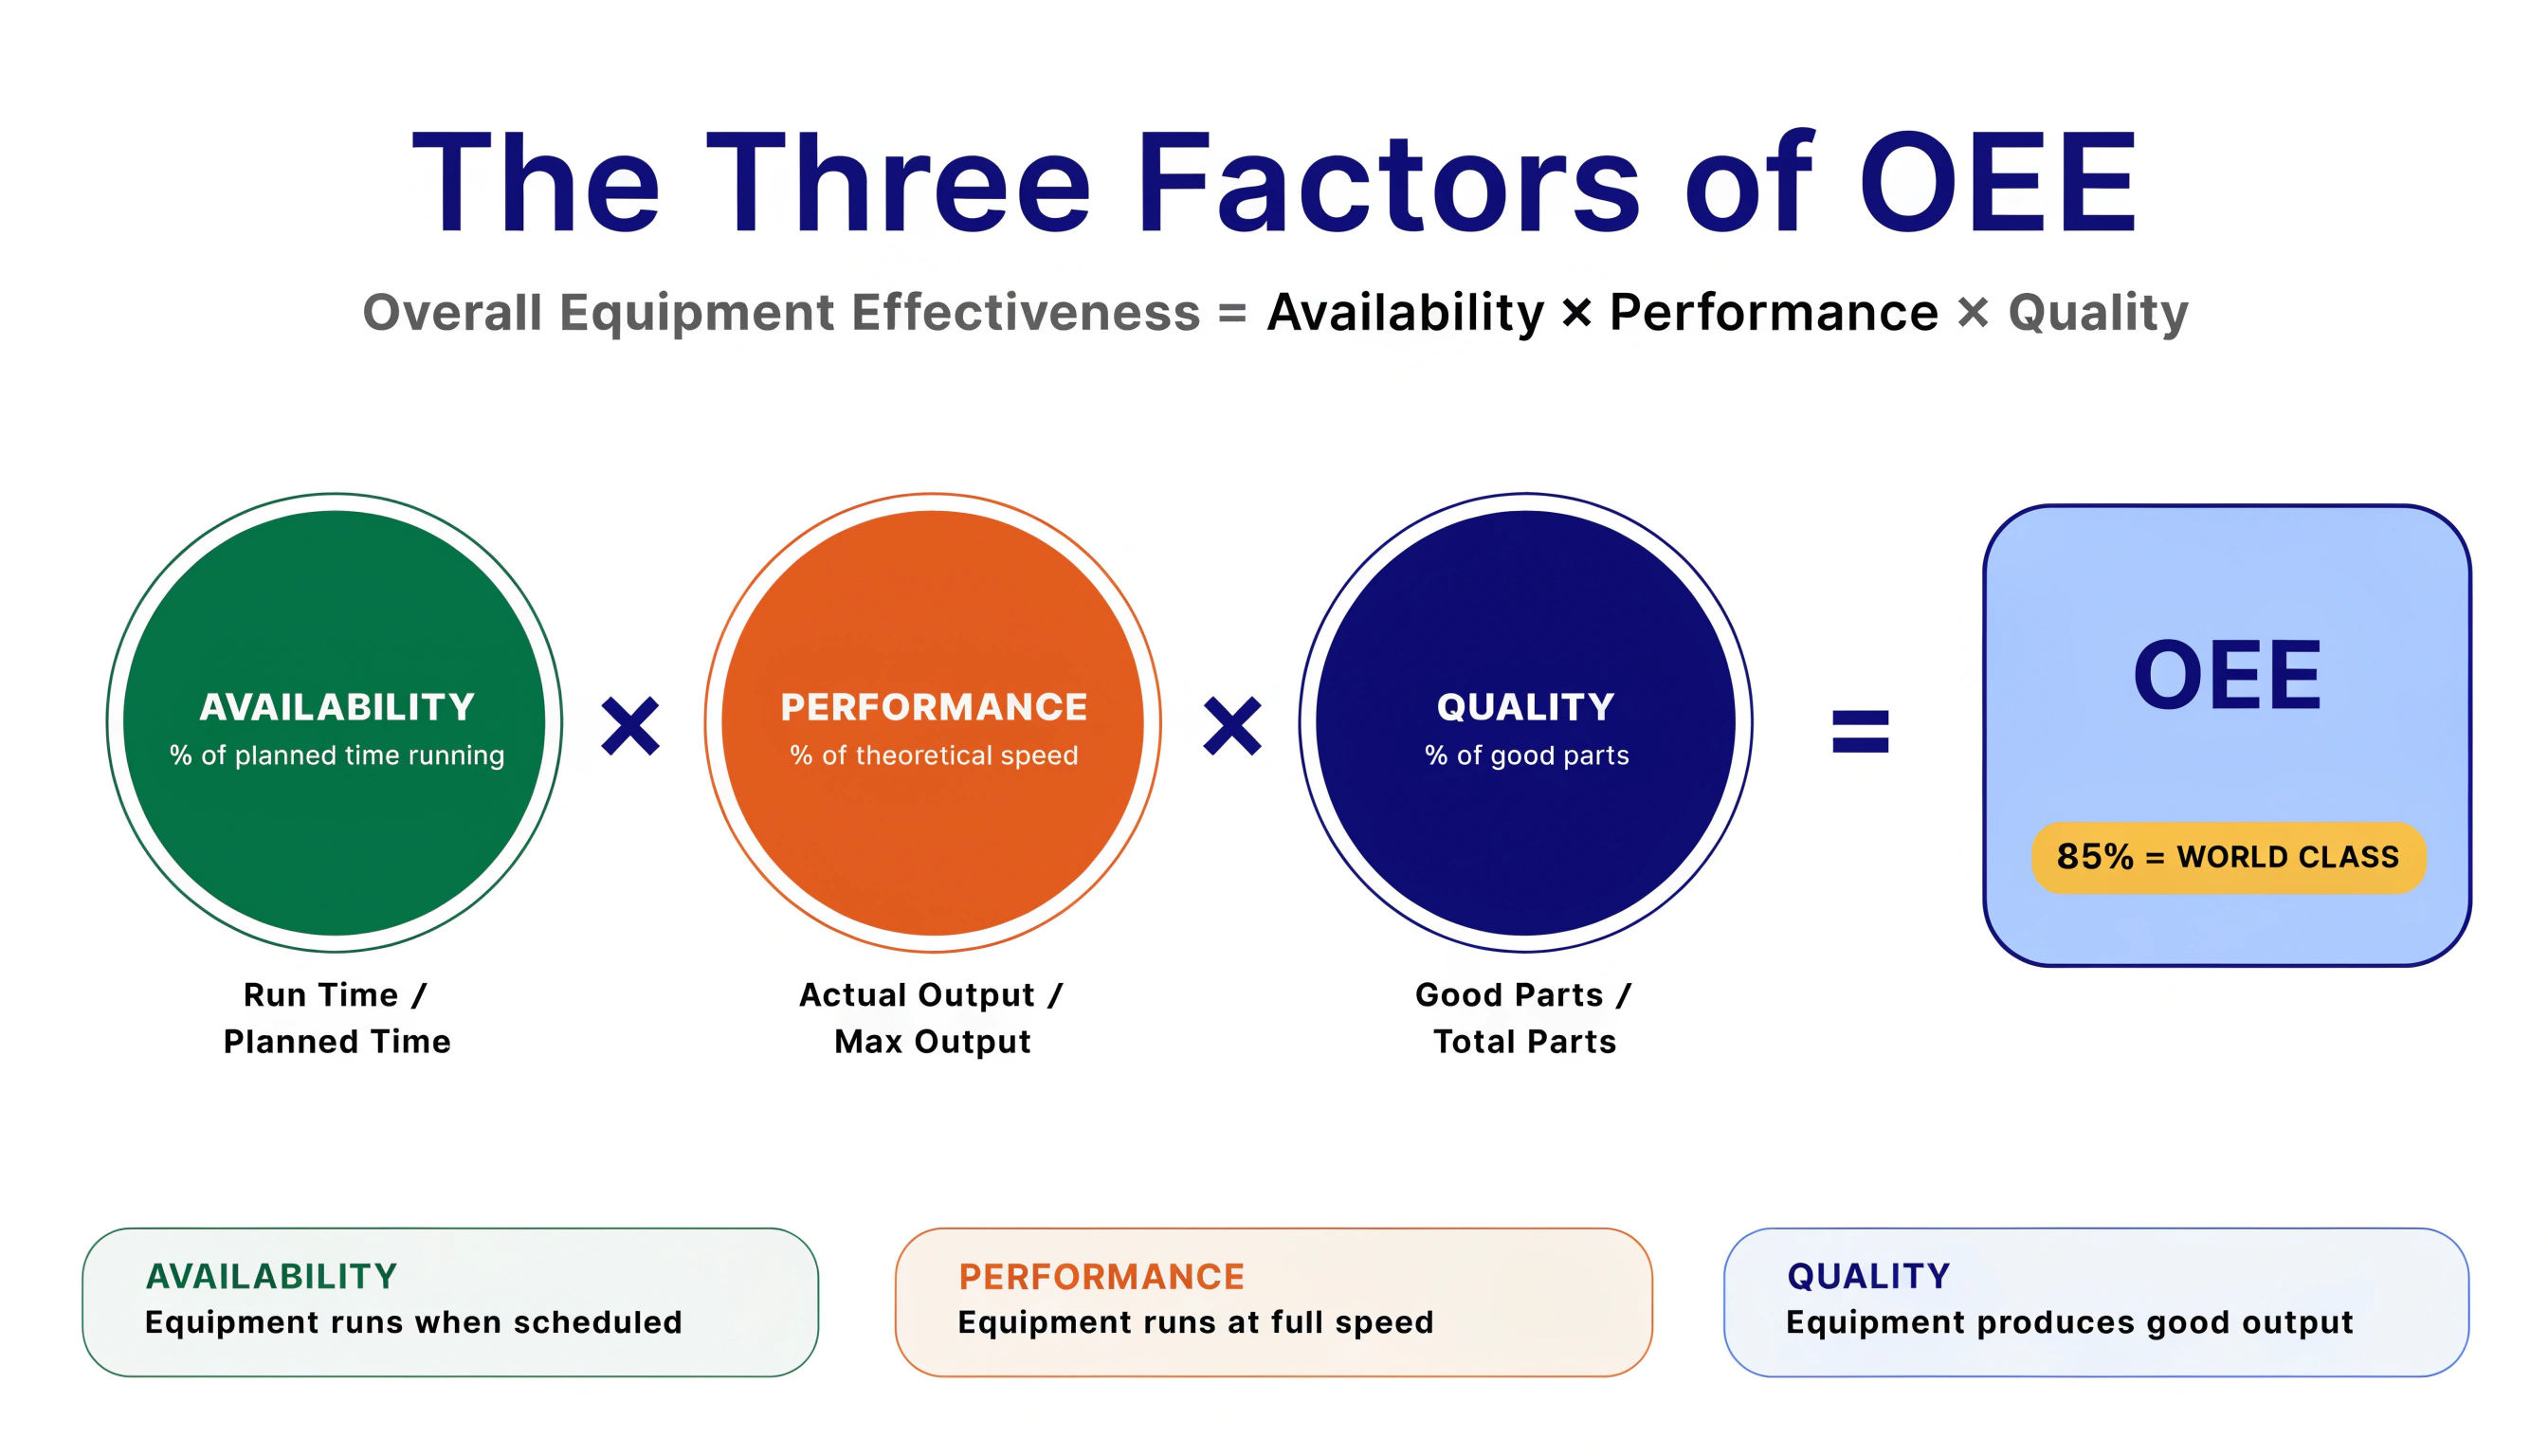
OEE = Availability x Performance x Quality
Each factor captures a different dimension of production efficiency:
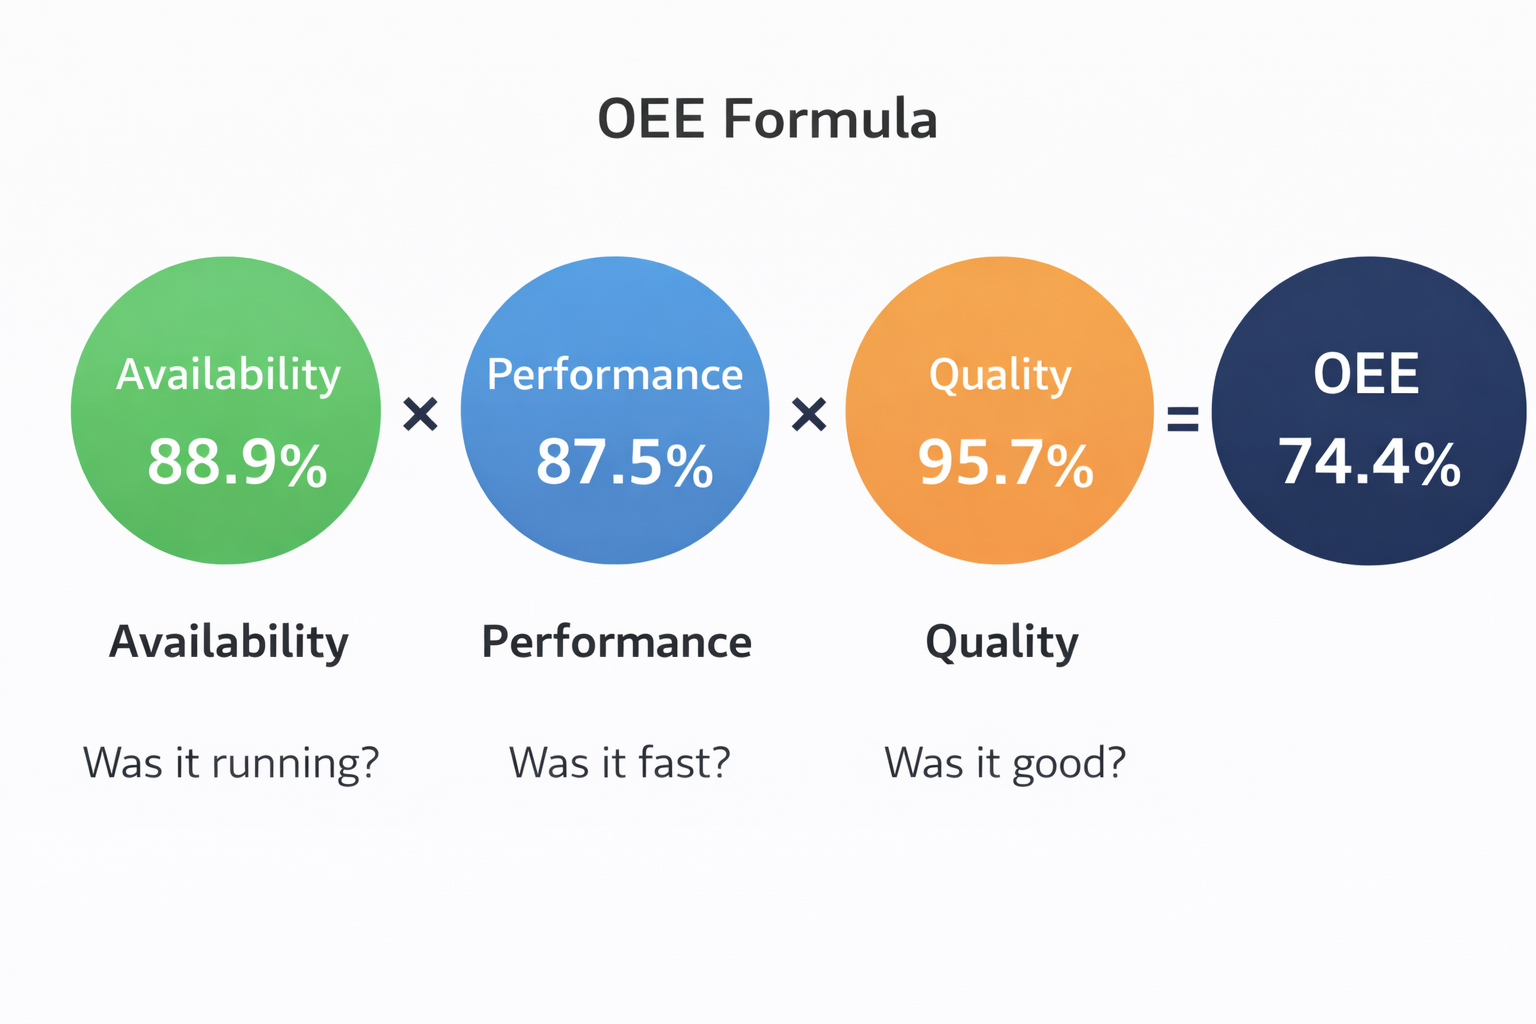 OEE = Availability x Performance x Quality. Each factor answers a simple question about your production.
| Factor | Question it answers | Formula |
|---|---|---|
| Availability | Was the equipment running when it should have been? | Run Time / Planned Production Time |
| Performance | Was it running at full speed? | (Ideal Cycle Time x Total Pieces) / Run Time |
| Quality | Were all products good? | Good Pieces / Total Pieces |
Concrete example
Imagine a packaging line with an 8-hour shift:
| Metric | Value |
|---|---|
| Shift duration | 480 min |
| Planned breaks | 30 min |
| Planned Production Time | 450 min |
| Unplanned downtime (breakdowns, changeovers) | 50 min |
| Run Time | 400 min |
| Ideal cycle time | 1 piece/min |
| Total pieces produced | 350 |
| Rejected pieces | 15 |
Calculations:
- Availability = 400 / 450 = 88.9%
- Performance = (1 x 350) / 400 = 87.5%
- Quality = (350 - 15) / 350 = 95.7%
- OEE = 88.9% x 87.5% x 95.7% = 74.4%
:::info World-class OEE benchmarks
- 85%+ is considered world-class for discrete manufacturing
- 60% is typical for manufacturers starting their OEE journey
- 40% is common for plants without systematic tracking
Most factories are surprised to discover their real OEE is much lower than they thought. That is actually good news; it means there is significant room for improvement. :::
The Six Big Losses
OEE was designed to combat the Six Big Losses: the most common causes of equipment inefficiency. Understanding these losses is key to improving your OEE score.
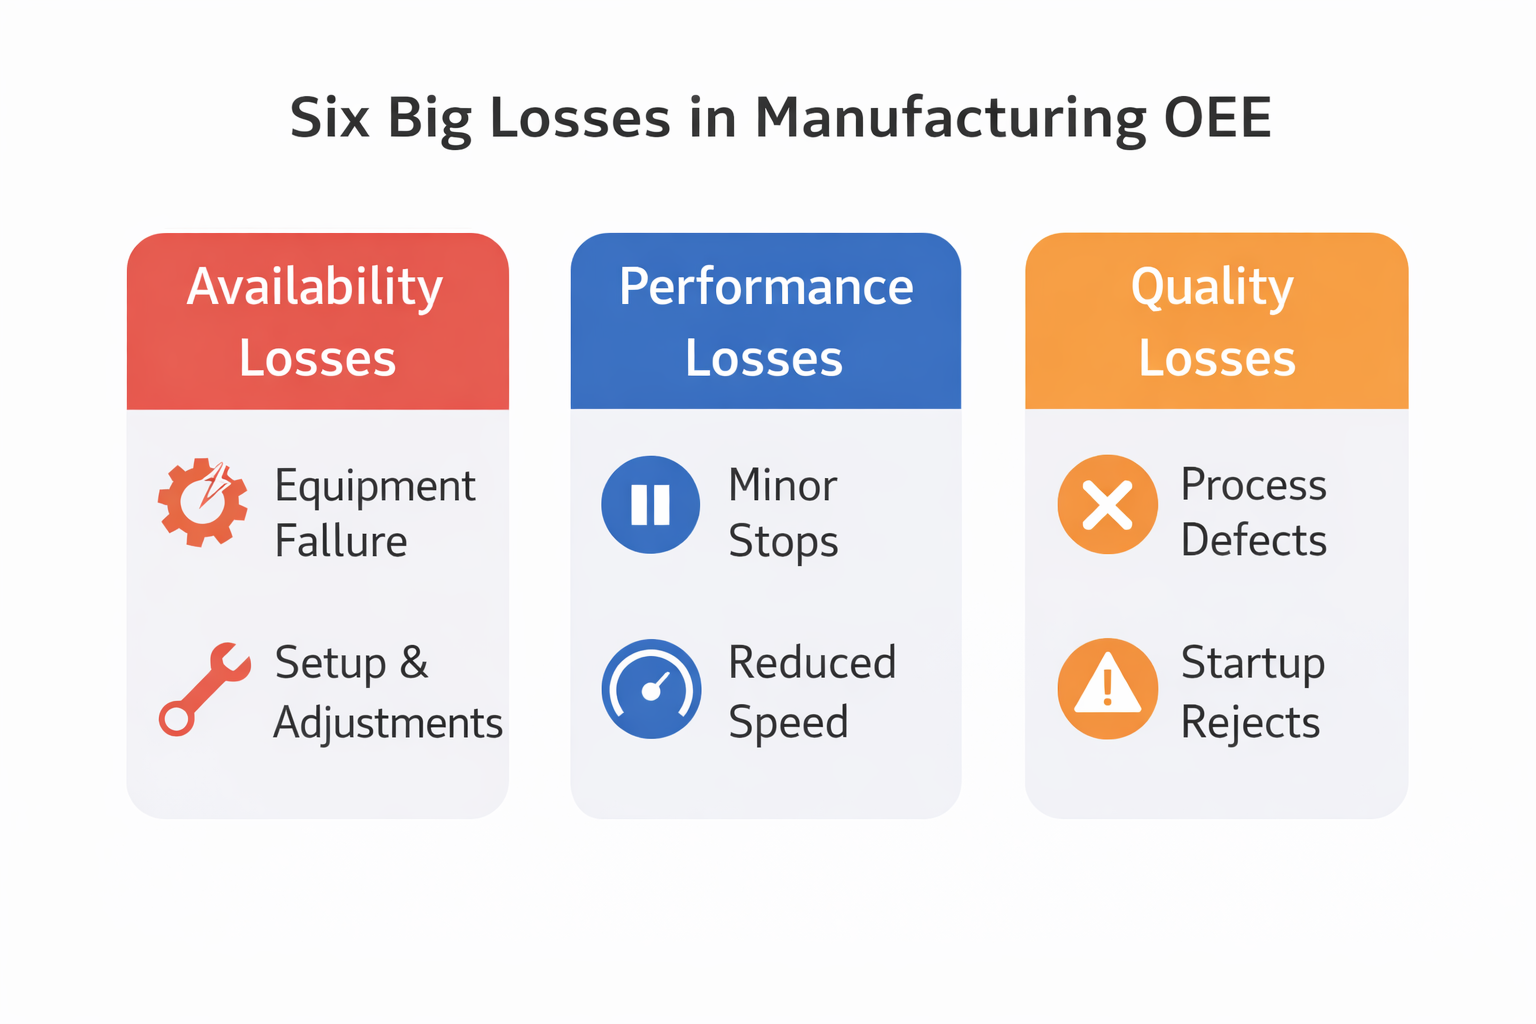 The Six Big Losses organized under Availability (red), Performance (blue), and Quality (orange).
Availability losses: "The equipment was not running"
These losses reduce the time the equipment is available for production:
- Equipment Failure: unplanned stops due to breakdowns, tooling failures, or maintenance needs. Example: A motor burns out and the line stops for 2 hours while maintenance replaces it.
- Setup & Adjustments: changeovers, warmup time, material changes, and planned stops during production. Example: Switching from Product A to Product B requires cleaning and recalibrating, taking 45 minutes.
Performance losses: "The equipment was running, but slowly"
These losses reduce the speed at which the equipment operates:
- Idling & Minor Stops: short interruptions (< 5 min) like jams, sensor blocks, or cleaning. Example: A bottle jams in the conveyor, an operator clears it in 30 seconds, but this happens 50 times per shift.
- Reduced Speed: running below the ideal cycle time due to wear, operator inexperience, or suboptimal settings. Example: The filler should do 100 bottles/min but only achieves 80 bottles/min because the cap feeder is misaligned.
Quality losses: "The equipment produced, but not all good"
These losses reduce the percentage of good products:
- Process Defects: defective pieces produced during stable production. Example: 2% of labels are misaligned due to a worn roller.
- Startup Rejects: defective pieces produced during warmup or after changeovers. Example: The first 20 bottles after a changeover have incorrect fill levels while the machine stabilizes.
In OpSee, each of these is tracked through Loss Types and Reasons, which you configure in the OEE Configuration module. See The Six Big Losses for a deep dive into each loss category with measurement guidance and countermeasures.
Understanding OEE visually
Here is how to visualize the relationship between total time, planned time, and productive time:
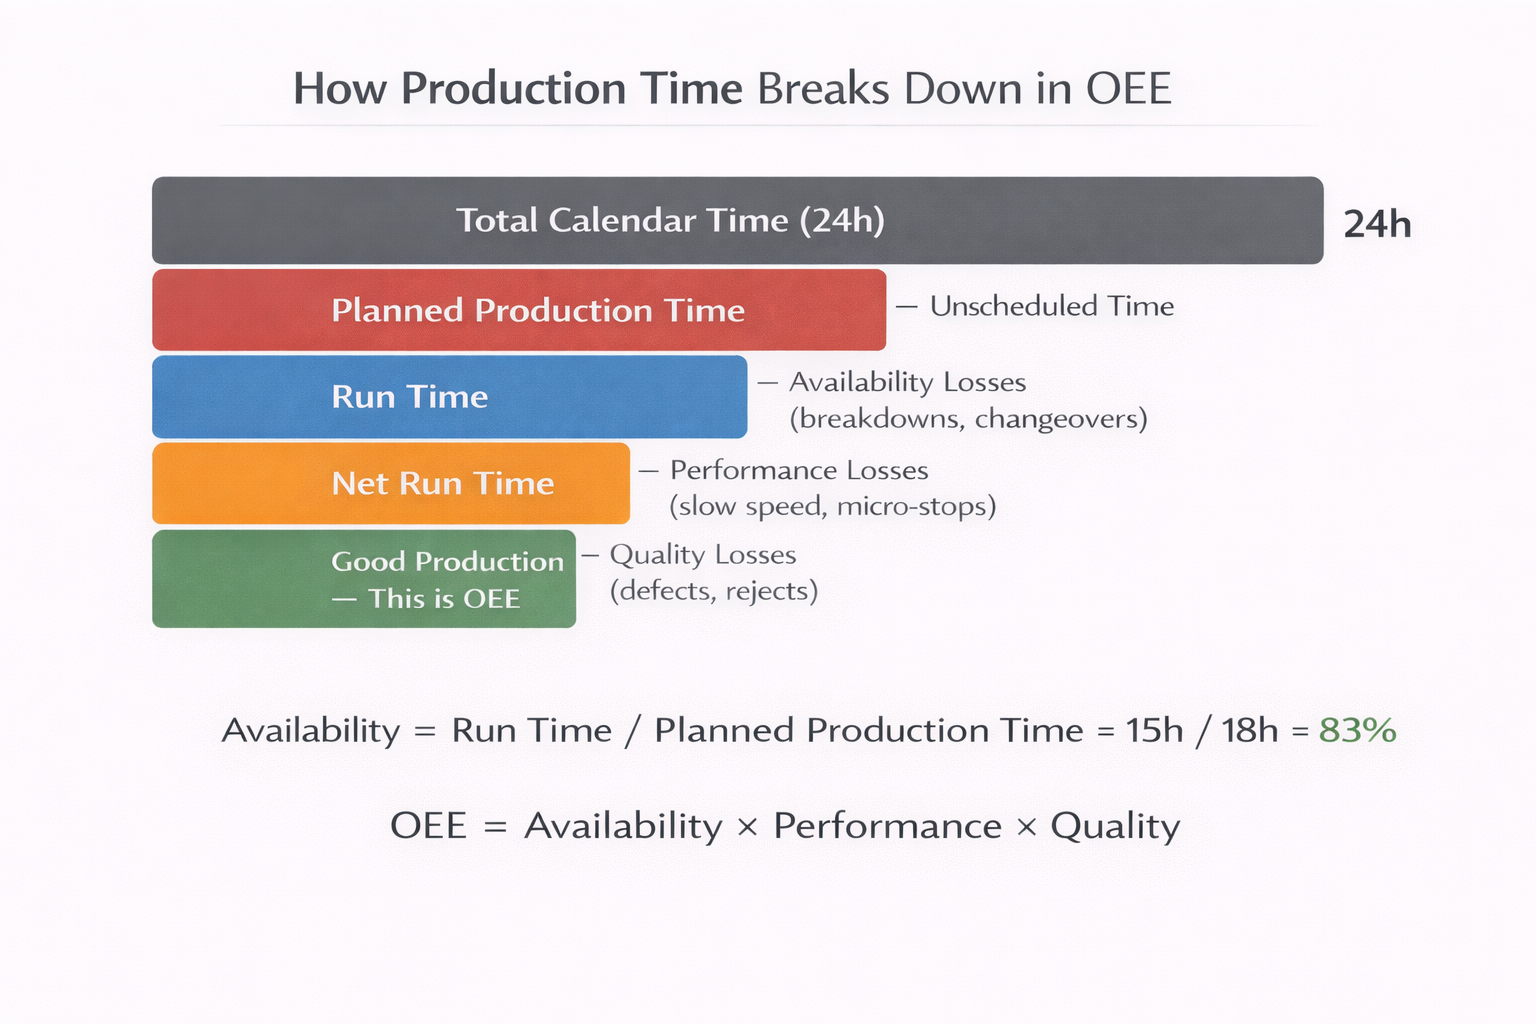 Each layer of losses reduces productive time. OEE measures how much Planned Production Time ends up as Good Production.
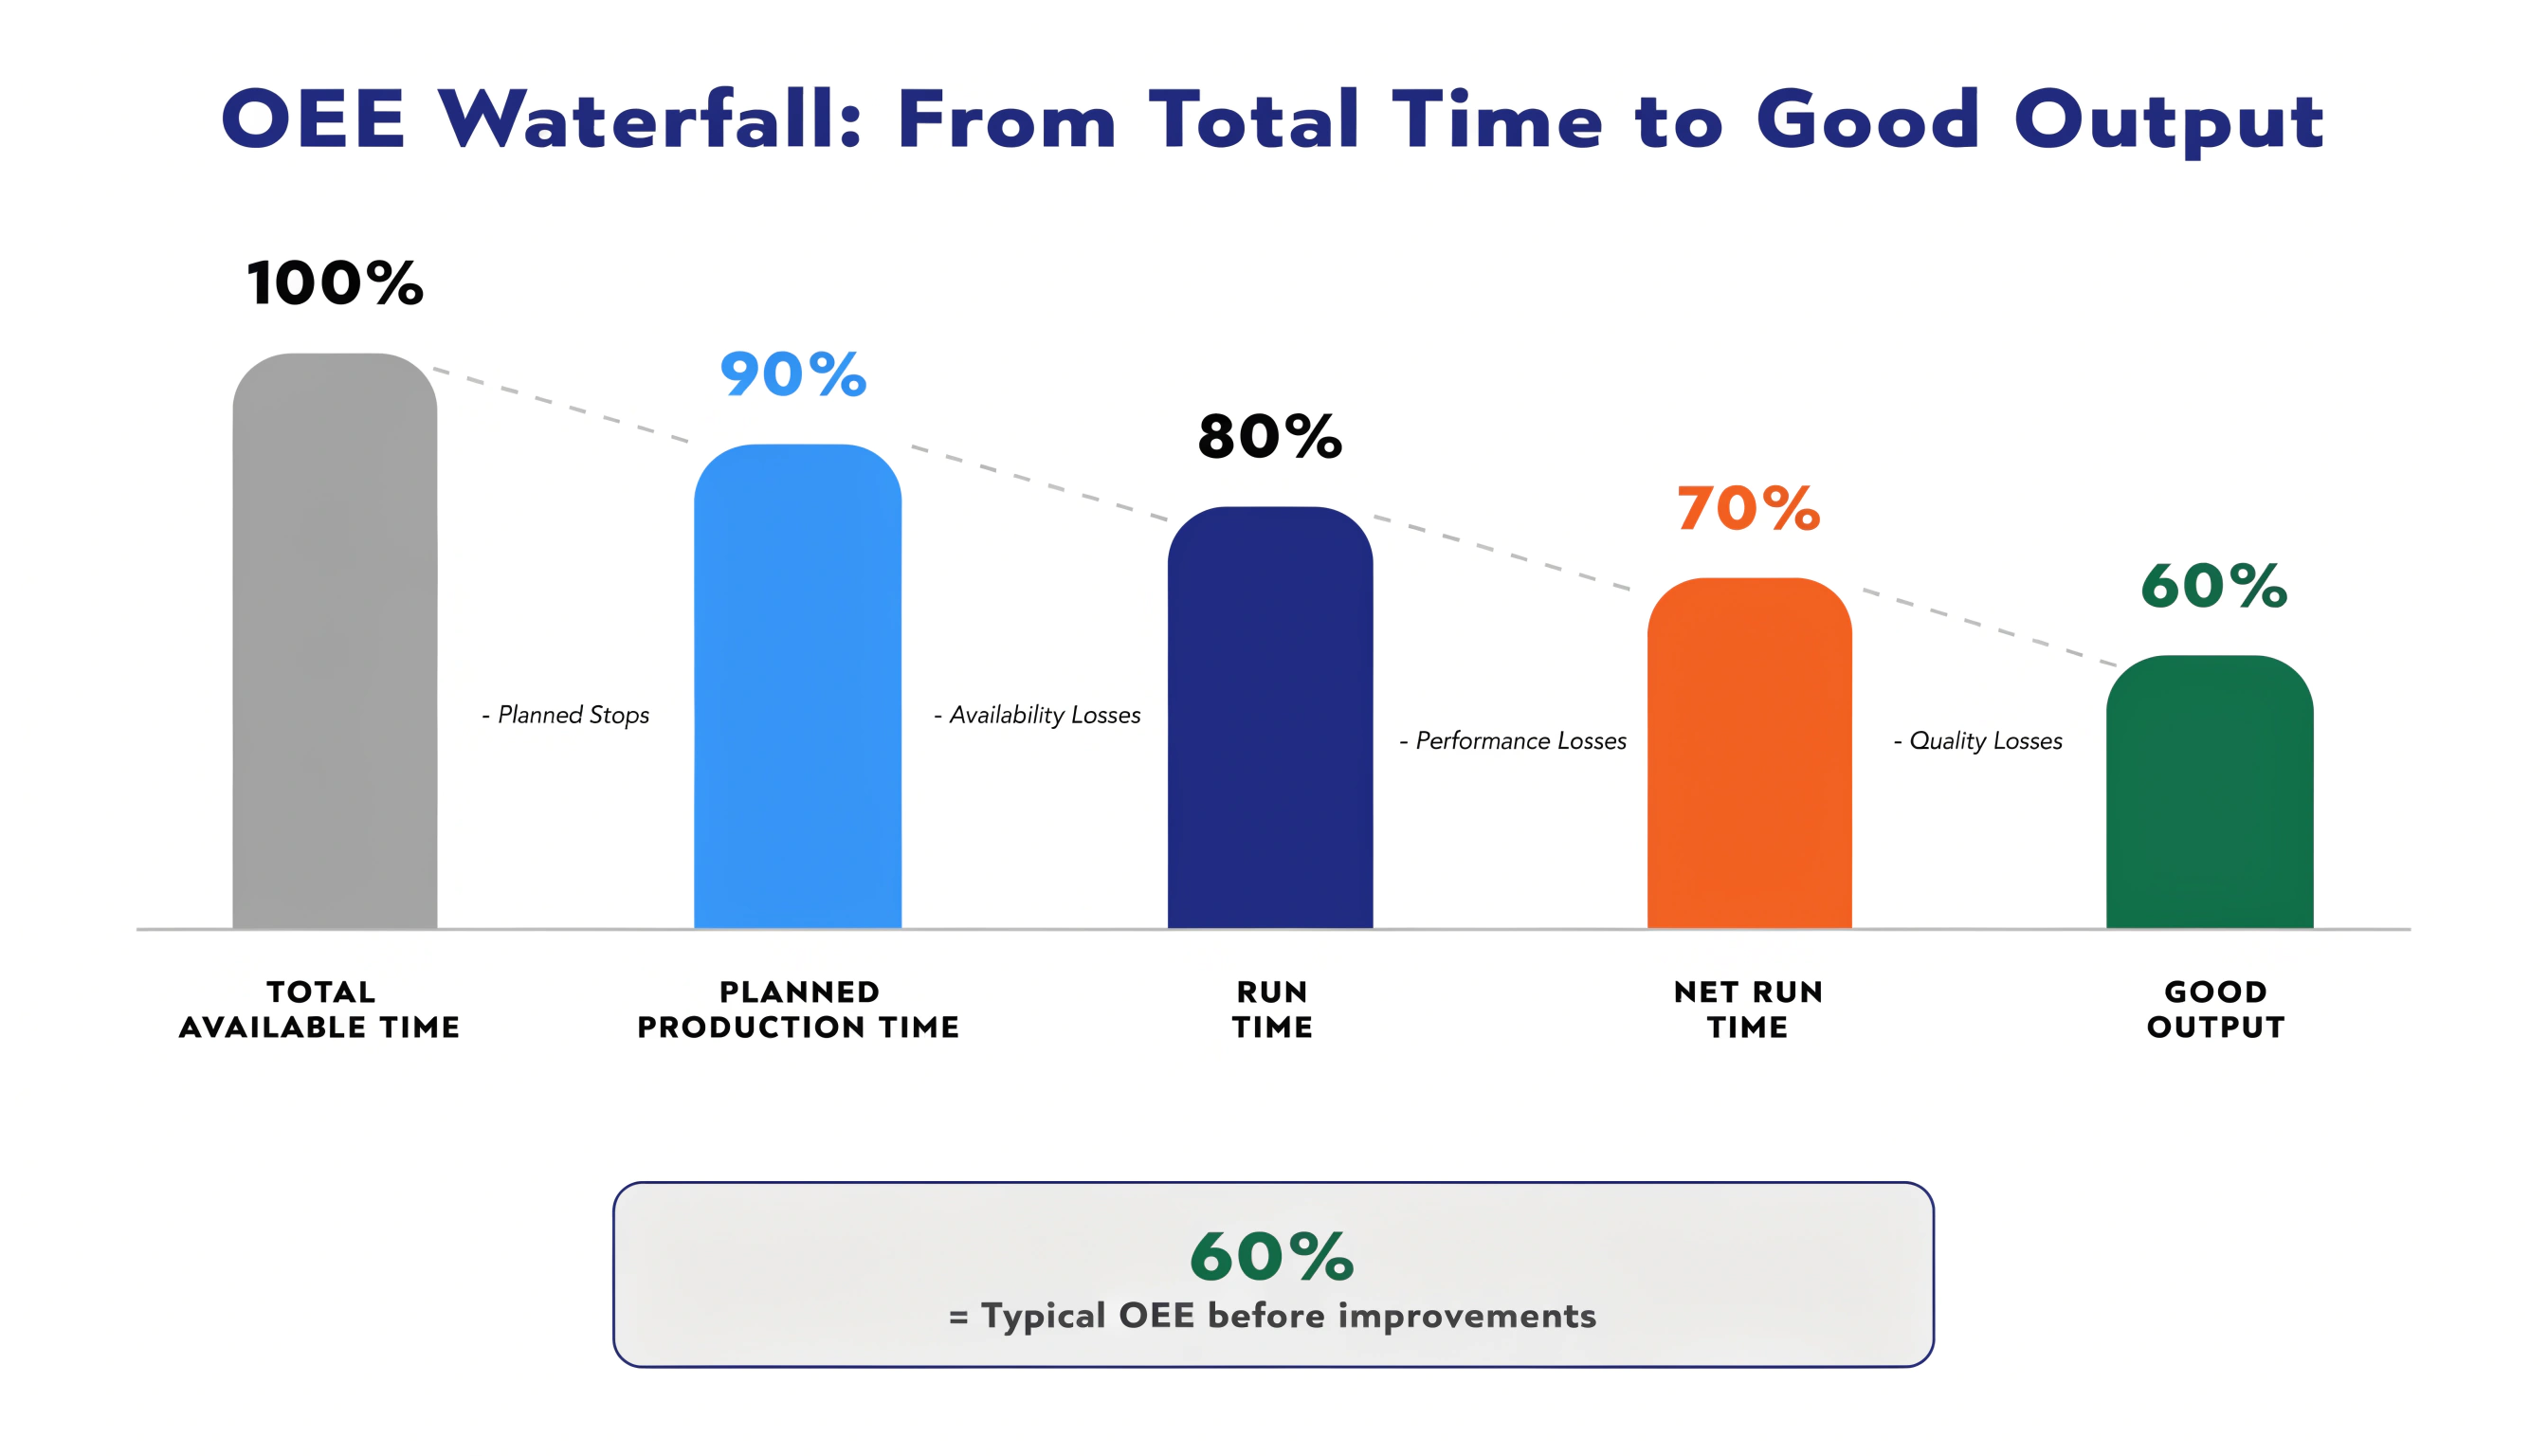
Reading from top to bottom:
- Total Calendar Time = the full 24 hours in a day
- Planned Production Time = Calendar Time minus unscheduled time (nights, weekends, breaks)
- Run Time = Planned Time minus availability losses (breakdowns, changeovers)
- Net Run Time = Run Time minus performance losses (slow cycles, micro-stops)
- Good Production = Net Run Time minus quality losses (defects, rejects)
Key OEE metrics in OpSee
Beyond the core OEE percentage, OpSee tracks several derived metrics:
| Metric | What it measures | Why it matters |
|---|---|---|
| MTTR (Mean Time To Repair) | Average time to fix a failure | Lower = faster recovery from breakdowns |
| MTBF (Mean Time Between Failures) | Average uptime between failures | Higher = more reliable equipment |
| Total Downtime | Sum of all stop durations in a period | Shows the total cost of lost production |
| Downtime Events | Count of individual stop occurrences | High count with low total = many micro-stops |
| Validation Rate | % of events reviewed by a supervisor | High rate = good tracking discipline |
These metrics are available as widgets in the Cockpit and as dashboards in the Production OEE module.
How OpSee calculates OEE
The OEE calculation pipeline in OpSee follows this flow:
- Data ingestion: equipment sensors publish state changes (running, stopped, idle) via MQTT or OPC-UA. OpSee's background workers ingest and store these events in TimescaleDB
- Availability tracking: each state change creates an availability record with a start time, end time, equipment ID, and associated loss type/reason
- On-demand calculation: when you open a dashboard or request a report, the OEE engine queries availability records for the selected time range and equipment, then computes Availability, Performance, and Quality in real time
- Drill-down: you can break down OEE by equipment, shift, time period, loss type, or reason to identify root causes
Next steps
- The Six Big Losses: identify and eliminate the six root causes of OEE loss
- MTTR and MTBF: equipment reliability metrics that complement OEE
- OEE Benchmarks: how your OEE compares to industry targets
- Equipment Model (ISA-95): understand how OpSee organizes equipment hierarchies
- Batch Model (ISA-88): learn about procedures and recipes
- Data Flow: see how data moves from sensors to dashboards
Prerequisites
- Introduction: get the overall picture of OpSee
Related
- The Six Big Losses: the six categories of manufacturing loss mapped to OEE factors
- MTTR and MTBF: equipment reliability metrics
- OEE Benchmarks: industry benchmarks and improvement targets
- OEE Configuration: configure loss types and reason trees in OpSee
- Production → OEE Dashboard: view OEE in real time