MTTR and MTBF
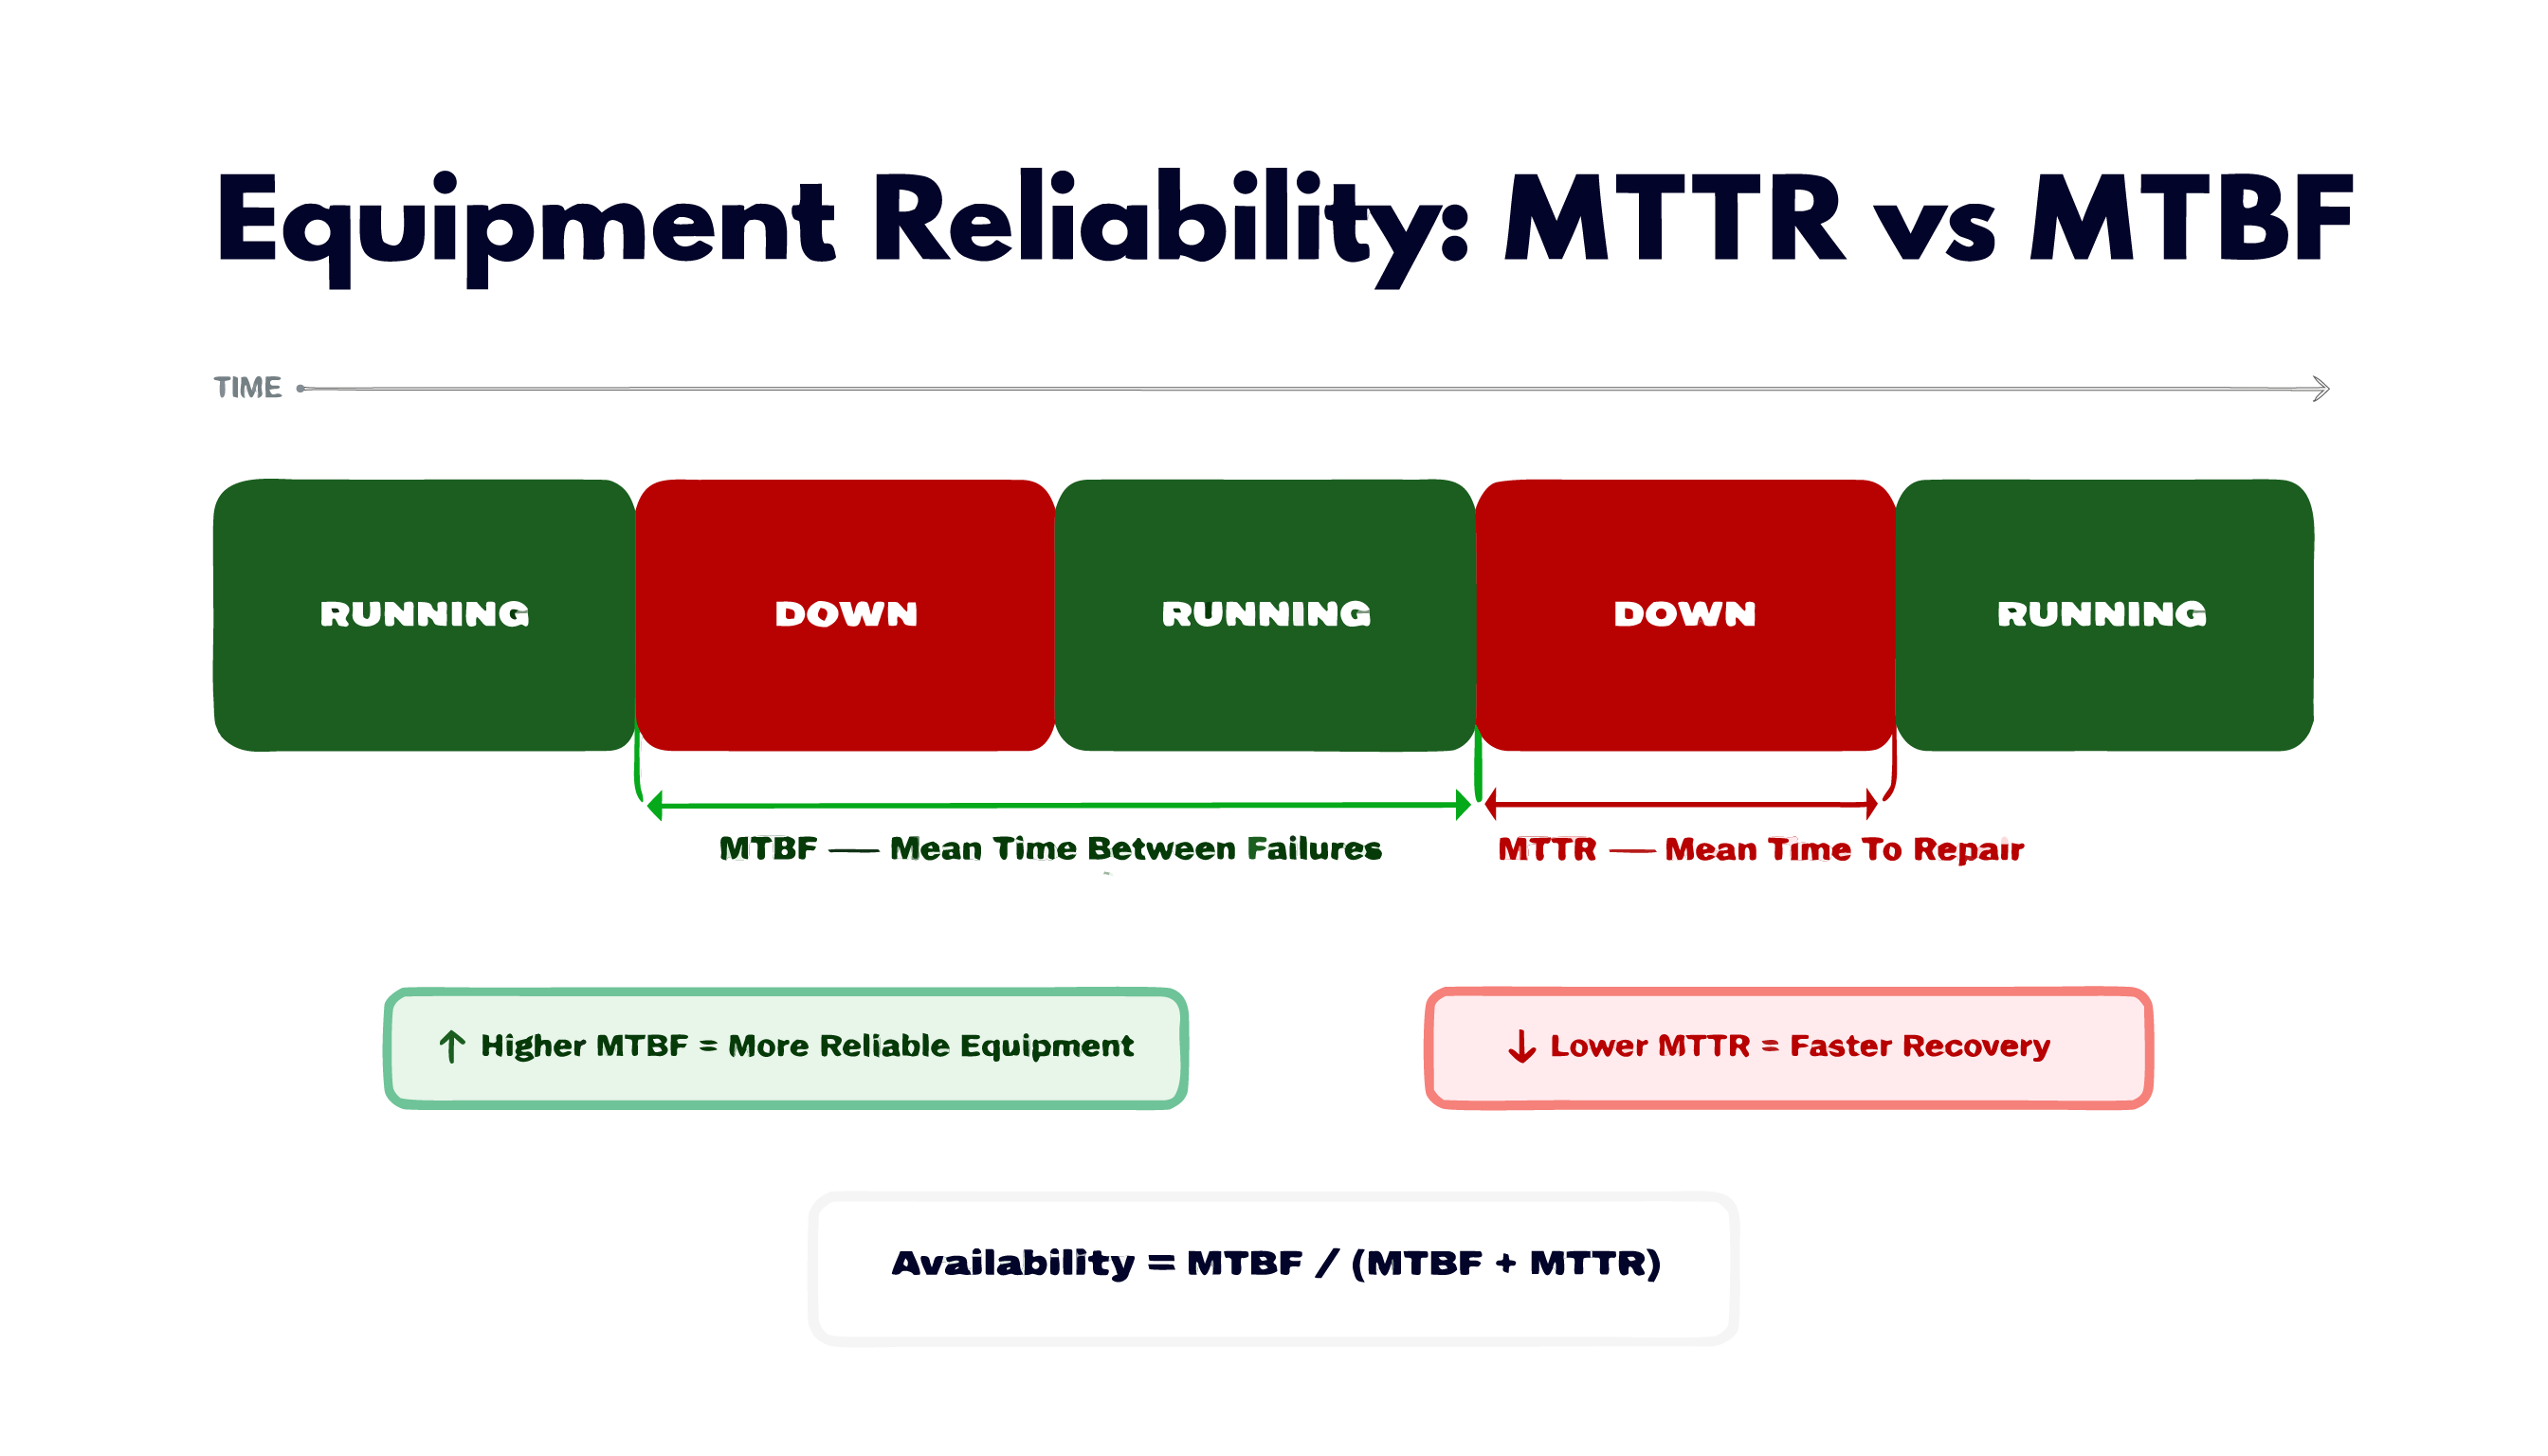
MTTR (Mean Time To Repair) and MTBF (Mean Time Between Failures) are reliability metrics that complement OEE. While OEE tells you how much production was lost, MTTR and MTBF tell you why, and what maintenance strategy you need to fix it.
:::info Quick Reference
| Metric | Formula | Goal |
|---|---|---|
| MTTR | Total Repair Time / Number of Failures | Minimize (faster recovery) |
| MTBF | Total Run Time / Number of Failures | Maximize (less failures) |
| MTBA | Total Time / Number of All Stops | Combined availability measure |
| ::: |
What is MTTR?
Mean Time To Repair measures how long it takes, on average, to restore equipment after a failure.
MTTR = Total Downtime caused by failures / Number of Failures
Example: A filling machine had 4 unplanned stops this week:
- Monday: 45 min (belt replacement)
- Tuesday: 12 min (sensor reset)
- Thursday: 2h 15min (pump failure)
- Friday: 28 min (jam clearance)
Total downtime = 45 + 12 + 135 + 28 = 220 minutes
Number of failures = 4
MTTR = 220 / 4 = 55 minutes
What MTTR tells you
A high MTTR means your team takes a long time to restore equipment. Causes include:
- Slow fault diagnosis (technicians do not know where to look)
- Spare parts not available locally (waiting for delivery)
- Lack of standardized repair procedures
- Equipment design that makes access difficult
- Insufficient maintenance skills for complex failures
A low MTTR means your team is fast and efficient at recovery, even if failures are frequent.
How to improve MTTR
| Intervention | Impact |
|---|---|
| Maintain spare parts inventory for critical components | Eliminates "waiting for parts" time |
| Create standardized repair checklists per failure type | Reduces diagnostic time |
| Train operators on first-level response (L1 maintenance) | Reduces time to first action |
| Design for maintainability in machine procurement | Reduces access time |
| Implement a clear escalation path (L1 → L2 → OEM) | Prevents wasted time at wrong level |
What is MTBF?
Mean Time Between Failures measures how long equipment runs, on average, between unplanned stops.
MTBF = Total Run Time / Number of Failures
Using the same example above, if the machine ran 38 hours this week:
Total run time = 38 hours = 2280 minutes
Number of failures = 4
MTBF = 2280 / 4 = 570 minutes = 9.5 hours
This means the machine fails, on average, every 9.5 hours of operation.
:::note A note on conventions: MTBF vs. MTTF Two conventions coexist in the literature for MTBF:
- Industrial / MES convention (used in OpSee): MTBF counts only uptime between failures (Total Run Time / Number of Failures). Under this convention,
Availability = MTBF / (MTBF + MTTR). - Strict / IEEE convention (Wikipedia): MTBF counts the full cycle including repair time (Total Time / Number of Failures), and a separate metric MTTF (Mean Time To Failure) is used for uptime only. Under this convention,
Availability = MTTF / (MTTF + MTTR) = (MTBF − MTTR) / MTBF.
Both formulations give the same numerical availability when applied consistently to their own definition of MTBF. In OpSee, our MTBF is equivalent to the IEEE MTTF: it measures only the time the equipment was actually running between failures, not the full cycle. This matches the convention used by most MES and OEE tooling in industry. :::
What MTBF tells you
A low MTBF means equipment is failing frequently. Root causes include:
- Aging equipment past end-of-life
- Deferred preventive maintenance
- Overloading (running above rated capacity)
- Poor operating environment (temperature, humidity, vibration)
- Inadequate lubrication or cleaning
A high MTBF means equipment is reliable, either because it is well-maintained or because it is new and robust.
How to improve MTBF
| Intervention | Impact |
|---|---|
| Implement preventive maintenance (PM) schedules | Replaces wear parts before failure |
| Monitor leading indicators (vibration, temperature, current) | Catch degradation before failure |
| Review overload conditions and operating parameters | Reduce stress on critical components |
| Analyze recurring failures for systemic root causes | Fix once instead of repeatedly |
MTTR vs. MTBF: different levers
MTTR and MTBF are separate levers for improving availability:
The relationship between availability, MTBF, and MTTR is:
Availability = MTBF / (MTBF + MTTR)
Example:
- MTBF = 570 min, MTTR = 55 min
- Availability = 570 / (570 + 55) = 570 / 625 = 91.2%
To reach 95% availability, you need either:
- MTBF = 1045 min (fail less often), or
- MTTR = 30 min (recover faster), or
- A combination of both
MTBF, MTTR, and OEE
MTBF and MTTR feed directly into OEE Availability:
- High MTBF → fewer stops → more production time → higher Availability
- Low MTTR → shorter stops → less lost time → higher Availability
However, MTBF and MTTR only cover Loss 1 (Equipment Failure). The other five Big Losses require different metrics to diagnose.
Viewing MTTR and MTBF in OpSee
OpSee calculates MTTR and MTBF automatically from availability records.
In the Cockpit
The following Cockpit widgets display reliability metrics:
| Widget | Shows |
|---|---|
| OEE MTTR | Average time to recover from failures, filterable by equipment and time range |
| OEE MTBF | Average time between failures, filterable by equipment and time range |
| OEE KPI Total Events | Count of failures (denominator for MTTR/MTBF) |
| OEE KPI Total Downtime | Total repair time (numerator for MTTR) |
In the OEE dashboard
The Production → OEE Dashboard includes a summary row with MTTR and MTBF alongside the standard OEE gauges. Filter by time period or specific equipment to isolate a machine or line.
Tips for accurate measurement
- Filter by unplanned stops only. MTTR and MTBF are meaningful only for unplanned failures. Include planned maintenance or changeovers and the numbers become misleading.
- Use consistent loss type classification. Operators must reliably classify stops as "Equipment Failure" vs. other categories. Inconsistent classification makes MTBF calculation unreliable.
- Look at trends, not snapshots. A single week's MTBF is noisy. Track 4-week rolling averages to see whether reliability is improving.
Practical benchmarks
| MTBF (per shift) | Interpretation |
|---|---|
| > 8 hours | Excellent: equipment rarely fails during a shift |
| 4–8 hours | Good: typically 1–2 unplanned stops per shift |
| 1–4 hours | Fair: requires attention; maintenance strategy review needed |
| < 1 hour | Poor: equipment is chronically unreliable |
| MTTR | Interpretation |
|---|---|
| < 10 min | Excellent: very fast recovery |
| 10–30 min | Good: typical for well-prepared maintenance teams |
| 30–90 min | Fair: room to improve spare parts and procedures |
| > 90 min | Poor: recovery takes too long; review diagnostics and parts availability |
Prerequisites
- OEE Fundamentals: understand OEE Availability first
- Six Big Losses: context for equipment failure losses
Next steps
- OEE Benchmarks: how your OEE compares to industry targets
Related
- Production → OEE Dashboard: view MTTR/MTBF for your equipment
- Cockpit → Widgets: MTTR and MTBF widgets